MACD Volume Strategy for XAUUSD (15m) [PineIndicators]The MACD Volume Strategy is a momentum-based trading system designed for XAUUSD on the 15-minute timeframe. It integrates two key market indicators: the Moving Average Convergence Divergence (MACD) and a volume-based oscillator to identify strong trend shifts and confirm trade opportunities. This strategy uses dynamic position sizing, incorporates leverage customization, and applies structured entry and exit conditions to improve risk management.
⚙️ Core Strategy Components
1️⃣ Volume-Based Momentum Calculation
The strategy includes a custom volume oscillator to filter trade signals based on market activity. The oscillator is derived from the difference between short-term and long-term volume trends using Exponential Moving Averages (EMAs)
Short EMA (default = 5) represents recent volume activity.
Long EMA (default = 8) captures broader volume trends.
Positive values indicate rising volume, supporting momentum-based trades.
Negative values suggest weak market activity, reducing signal reliability.
By requiring positive oscillator values, the strategy ensures momentum confirmation before entering trades.
2️⃣ MACD Trend Confirmation
The strategy uses the MACD indicator as a trend filter. The MACD is calculated as:
Fast EMA (16-period) detects short-term price trends.
Slow EMA (26-period) smooths out price fluctuations to define the overall trend.
Signal Line (9-period EMA) helps identify crossovers, signaling potential trend shifts.
Histogram (MACD – Signal) visualizes trend strength.
The system generates trade signals based on MACD crossovers around the zero line, confirming bullish or bearish trend shifts.
📌 Trade Logic & Conditions
🔹 Long Entry Conditions
A buy signal is triggered when all the following conditions are met:
✅ MACD crosses above 0, signaling bullish momentum.
✅ Volume oscillator is positive, confirming increased trading activity.
✅ Current volume is at least 50% of the previous candle’s volume, ensuring market participation.
🔻 Short Entry Conditions
A sell signal is generated when:
✅ MACD crosses below 0, indicating bearish momentum.
✅ Volume oscillator is positive, ensuring market activity is sufficient.
✅ Current volume is less than 50% of the previous candle’s volume, showing decreasing participation.
This multi-factor approach filters out weak or false signals, ensuring that trades align with both momentum and volume dynamics.
📏 Position Sizing & Leverage
Dynamic Position Calculation:
Qty = strategy.equity × leverage / close price
Leverage: Customizable (default = 1x), allowing traders to adjust risk exposure.
Adaptive Sizing: The strategy scales position sizes based on account equity and market price.
Slippage & Commission: Built-in slippage (2 points) and commission (0.01%) settings provide realistic backtesting results.
This ensures efficient capital allocation, preventing overexposure in volatile conditions.
🎯 Trade Management & Exits
Take Profit & Stop Loss Mechanism
Each position includes predefined profit and loss targets:
Take Profit: +10% of risk amount.
Stop Loss: Fixed at 10,100 points.
The risk-reward ratio remains balanced, aiming for controlled drawdowns while maximizing trade potential.
Visual Trade Tracking
To improve trade analysis, the strategy includes:
📌 Trade Markers:
"Buy" label when a long position opens.
"Close" label when a position exits.
📌 Trade History Boxes:
Green for profitable trades.
Red for losing trades.
📌 Horizontal Trade Lines:
Shows entry and exit prices.
Helps identify trend movements over multiple trades.
This structured visualization allows traders to analyze past performance directly on the chart.
⚡ How to Use This Strategy
1️⃣ Apply the script to a XAUUSD (Gold) 15m chart in TradingView.
2️⃣ Adjust leverage settings as needed.
3️⃣ Enable backtesting to assess past performance.
4️⃣ Monitor volume and MACD conditions to understand trade triggers.
5️⃣ Use the visual trade markers to review historical performance.
The MACD Volume Strategy is designed for short-term trading, aiming to capture momentum-driven opportunities while filtering out weak signals using volume confirmation.
Cari dalam skrip untuk "take profit"

Hanzo_Wave_Price %Hanzo_Wave_Price % is a custom indicator for the TradingView platform that combines RSI (Relative Strength Index) and Stochastic RSI while also displaying the percentage price change over a specified period. This indicator helps traders identify overbought and oversold conditions, analyze price waves, and forecast potential market movements.
How It Works
1. RSI and Stochastic RSI Calculation
RSI is calculated based on the selected price source (default: close) with a user-defined Main Line period.
Stochastic RSI is then applied and smoothed using a moving average.
The Main Line represents the smoothed Stochastic RSI, serving as a wave indicator to help identify potential entry and exit points.
2. Overbought and Oversold Zones
The 70 and 30 levels indicate overbought and oversold zones, displayed as dashed lines on the chart.
Additional 20% and 10% levels provide a visual reference for historical price changes, aiding in future predictions.
3. Percentage Price Change Calculation
The indicator calculates the percentage price change over a Barsback period (default: 30 candles).
Users can choose a multiplier (100 or 1000) for better visualization (1000 scales the values by dividing by 10).
The data is displayed as a colored area:
Red (Short) → Negative price change.
Green (Buy) → Positive price change.
Settings & Parameters
Multiplier 💪 – Selects the scaling factor (100 or 1000) for percentage values.
Main Line ✈️ – Stochastic smoothing period (smoothK).
Don't touch ✋ – Reserved value (do not modify).
RSI 🔴 – RSI calculation period.
Stochastic 🔵 – Stochastic RSI calculation period.
Source ⚠️ – Price source for calculations (default: close).
Price changes % 🔼🔽 – Enables percentage price change display.
Barsback ↩️ – Number of candles used to calculate price change.
Visual Representation
Gray Line (Takeprofit Line 🎯) – Smoothed Stochastic RSI.
Red Dashed Line (70) – Overbought zone.
Blue Dashed Line (30) – Oversold zone.
Percentage Price Change Display:
Green Fill → Price increase.
Red Fill → Price decrease.
Advantages
✅ Combined Analysis – Uses RSI and Stochastic RSI for more accurate market condition identification.
✅ Flexibility – Customizable parameters allow adaptation for different markets and strategies.
✅ Visual Clarity – Clearly defined zones and dynamic percentage change display.
✅ Additional Market Insights – The percentage price change helps assess market volatility.
Disadvantages
⚠ Lagging Signals – Smoothing may cause delayed response.
⚠ False Breakouts – The 70/30 levels may not always work effectively for all assets.
⚠ IMPORTANT!
This indicator is for informational and educational purposes only. Past performance does not guarantee future profits! Use it in combination with other technical analysis tools. 🚀
Example 1: Identifying a Long Position
📌 Scenario:
The asset price has dropped significantly (1-hour timeframe), and the Main Line (gray line) crosses below the 30 level. This signals oversold conditions, which may indicate a potential reversal or upward correction.
✅ How to Use:
1️⃣ Identifying the Entry Zone:
If the Main Line is below 30, consider looking for a long entry point.
2️⃣ Confirming the Signal:
Place a vertical line at the moment when the Main Line crosses the 30 level from below.
3️⃣ Confirmation on a Lower Timeframe:
Switch to a 30-minute timeframe and wait for the Main Line to cross above the 70 level.
Enter a long position at this point.
4️⃣ Analyzing Percentage Price Change:
Check the historical indicator behavior:
If a similar past movement resulted in a ~10% price increase (green fill), this may indicate potential upward momentum.
5️⃣ Setting Take-Profit:
Set a take-profit level at 10%, based on previous price movements.
Also, monitor when the Main Line crosses the 70 level, as this may signal a potential profit-taking point.
📊 Conclusion:
This method helps to precisely determine entry points by confirming signals across multiple timeframes and analyzing the historical volatility of the asset. 🚀
Example 2: Analyzing Percentage Price Change
📌 Scenario:
You have set the Barsback parameter to 30, and the indicator shows +3.5%. This means that over the last 30 candles, the price has increased by 3.5%.
However, such small changes might be visually difficult to notice. To improve visibility, you can enable the multiplier (1000), which will scale the displayed percentage change to 35%. This is purely for visual convenience—the actual price movement remains 3.5%.
✅ How to Use:
1️⃣ Identifying Trend Direction:
If the percentage change is positive (green area) → Uptrend.
If the percentage change is negative (red area) → Downtrend.
2️⃣ Analyzing Movement Strength:
Compare the current percentage change with previous waves to evaluate the strength of the movement.
For example:
If previous waves reached 10% or more, a current wave of 3.5% might indicate a weak trend or a local correction.
3️⃣ Additional Filtering with the Main Line (Gray Line):
Use the Main Line to confirm the trend.
If the percentage change shows an increase, but the Main Line is still below 30, further upward movement can be expected.
If the percentage change indicates a decline, but the Main Line is above 70, there is a higher probability of a downward reversal.
"It's unfortunate that TradingView restricts adding images to indicator descriptions unless you have a paid subscription. This makes it harder to share free tools effectively."

Pivot Candles with MFI Opacity (No Plot)How to Use the Pivot Candles with MFI Opacity Indicator for Trade Entries and Position Management
Overview
This indicator is designed not only to display key pivot levels (support and resistance) and Money Flow Index (MFI) signals on your chart, but also to help you structure systematic order entries and position management. By combining pivot levels with dynamic MFI-based candle opacity, the indicator provides a visual framework that technical analysts and quants can use to time buy and sell stop orders as well as to pyramid positions or take profits.
Trade Entry with Pivot Levels
Buy Stop Orders Above R1:
Concept: In many technical setups, resistance levels such as R1 are viewed as potential breakout points. A buy stop order placed just above R1 allows you to enter a long position only when price decisively breaks the prior resistance, confirming bullish momentum.
How It Works:
The indicator calculates pivot levels based on the previous higher‑timeframe bar, so R1 is “locked in” for the current period.
When the current candle closes above R1, it may signal a breakout.
Technical analysts often place a buy stop order slightly above R1 (for example, a few ticks or pips above the level) to confirm the move.
Practical Application:
Quants and systematic traders can program their models to monitor when the current close exceeds R1.
Once this condition is met, a buy stop order is triggered to capture the breakout move, ensuring that you only participate if the price decisively moves upward.
Sell Stop Orders Below S1:
Concept: Conversely, S1 acts as a support level. A sell stop order placed just below S1 is designed to capture a breakdown. This order is activated when price closes below S1, indicating that selling pressure may be overwhelming.
How It Works:
With pivot levels fixed from the previous higher‑timeframe bar, S1 provides a reference for potential support.
A close below S1 can be interpreted as a sign of a bearish reversal or a continuation of a downtrend.
Practical Application:
Quants set up their systems to watch for a break below S1.
A sell stop order is positioned just below S1 to ensure that if the support level fails, the system can quickly initiate a short position to capture the downward move.
Using MFI for Position Management
Pyramiding and Profit Taking:
Dynamic Candle Opacity:
The Money Flow Index (MFI) in this indicator not only provides overbought/oversold alerts but also controls the opacity of your candlesticks. When MFI readings are high, the candles become more opaque, indicating strong buying pressure. Conversely, lower MFI values lead to more transparent candles, suggesting reduced momentum.
Pyramiding Long Positions:
Strategy:
In a strong trend, technical analysts might choose to add to a winning position gradually—a process known as pyramiding.
Implementation:
As long as the price remains above R1 and MFI readings are supportive (high and consistent), you may consider adding to your long position incrementally.
Each new buy stop order can be set above R1 with slightly adjusted trigger levels to capture further breakout strength.
Risk Management:
Quants use the MFI reading as a risk filter; if MFI begins to drop or the candles become significantly more transparent, it may be a cue to stop pyramiding or even begin taking profits.
Taking Profit Using MFI and Pivot Reversals:
Profit Targeting:
When price reaches higher resistance levels (e.g., R2 or R3) or shows signs of overextension in conjunction with extreme MFI levels (for instance, a sudden drop in MFI after a strong rally), you can begin taking partial profits.
Systematic Exit:
A systematic strategy might include scaling out of the position as the price approaches the next resistance level or when the MFI indicates that buying momentum is waning.
Similarly, for short positions entered below S1, profit targets might be set near subsequent support levels, with exits triggered if MFI suggests a reversal.
Summary
Entry Orders:
Place buy stop orders just above R1 to capture breakouts.
Place sell stop orders just below S1 to capture breakdowns.
Position Management with MFI:
Use MFI-based candle opacity as a visual indicator of momentum.
Pyramid positions in the direction of the trend when MFI confirms strength.
Consider partial exits if MFI readings start to reverse or if the price nears the next pivot level.
By following this systematic approach, technical analysts and quants can use the indicator not only as a visual tool but as an integral part of an automated or semi-automated trading system that emphasizes disciplined entries, pyramiding, and profit-taking.

2xSPYTIPS Strategy by Fra public versionThis is a test strategy with S&P500, open source so everyone can suggest everything, I'm open to any advice.
Rules of the "2xSPYTIPS" Strategy :
This trading strategy is designed to operate on the S&P 500 index and the TIPS ETF. Here’s how it works:
1. Buy Conditions ("BUY"):
- The S&P 500 must be above its **200-day simple moving average (SMA 200)**.
- This condition is checked at the **end of each month**.
2. Position Management:
- If leverage is enabled (**2x leverage**), the purchase quantity is increased based on a configurable percentage.
3. Take Profit:
- A **Take Profit** is set at a fixed percentage above the entry price.
4. Visualization & Alerts:
- The **SMA 200** for both S&P 500 and TIPS is plotted on the chart.
- A **BUY signal** appears visually and an alert is triggered.
What This Strategy Does NOT Do
- It does not use a **Stop Loss** or **Trailing Stop**.
- It does not directly manage position exits except through Take Profit.

Pure Price Action Breakout with 1:5 RR
Description of the Price Action Trading Script (Pine Script v6)
Overview
This script is a pure price action-based breakout strategy designed for TradingView. It identifies key breakout levels and executes long and short trades based on market structure. The strategy ensures a minimum risk-to-reward ratio (RR) of 1:5, aiming for high profitability with well-defined stop-loss and take-profit levels.
How the Script Works
1️⃣ Breakout Identification
The script uses a lookback period to find the highest high and lowest low over the last n bars.
A bullish breakout occurs when the price closes above the previous highest high.
A bearish breakout happens when the price closes below the previous lowest low.
2️⃣ Entry & Exit Strategy
Long Entry: If a bullish breakout is detected, the script enters a long position.
Short Entry: If a bearish breakout is detected, the script enters a short position.
The stop-loss is placed at the recent swing low (for long trades) or recent swing high (for short trades).
The target price is calculated based on a risk-to-reward ratio of 1:5, ensuring profitable trades.
3️⃣ Risk Management
The stop-loss prevents excessive losses by exiting trades when the market moves unfavorably.
The strategy ensures that each trade has a reward potential at least 5 times the risk.
Positions are executed based on price action only, without indicators like moving averages or RSI.
4️⃣ Visual Representation
The script plots breakout levels to help traders visualize potential trade setups.
Entry points, stop-loss, and take-profit levels are labeled on the chart for easy tracking.
Key Features & Benefits
✔ Pure Price Action – No lagging indicators, only real-time price movements.
✔ High Risk-to-Reward Ratio (1:5) – Ensures high-profit potential trades.
✔ Real-time Entry & Exit Signals – Provides accurate trade setups.
✔ Dynamic Stop-loss Calculation – Adjusts based on recent market structure.
✔ Customizable Parameters – Lookback periods and risk ratios can be modified.

AdvancedLines (FiboBands) - PaSKaL
Overview :
AdvancedLines (FiboBands) - PaSKaL is an advanced technical analysis tool designed to automate the plotting of key Fibonacci retracement levels based on the highest high and lowest low over a customizable period. This indicator helps traders identify critical price zones such as support, resistance, and potential trend reversal or continuation points.
By using AdvancedLines (FiboBands) - PaSKaL , traders can easily spot key areas where the price is likely to reverse or consolidate, or where the trend may continue. It is particularly useful for trend-following, scalping, and range-trading strategies.
Key Features:
Automatic Fibonacci Level Calculation :
- The indicator automatically calculates and plots key Fibonacci levels (0.236, 0.382, 0.5, 0.618, and 0.764), which are crucial for identifying potential support and resistance levels in the market.
Adjustable Parameters :
- Bands Length: You can adjust the bands_length setting to change the number of bars used for calculating the highest high and lowest low. This gives flexibility for using the indicator on different timeframes and trading styles.
- Visibility: The Fibonacci levels, as well as the midline (0.5 Fibonacci level), can be shown or hidden based on your preference.
- Color Customization: You can change the color of each Fibonacci level and background fills to suit your chart preferences.
Fibonacci Levels
- The main Fibonacci levels plotted are:
- 0.236 – Minor support/resistance level
- 0.382 – Moderate retracement level
- 0.5 – Midpoint retracement, often used as a key level
- 0.618 – Golden ratio, considered one of the most important Fibonacci levels
- 0.764 – Strong reversal level, often indicating a continuation or change in trend
Background Fill
- The indicator allows you to fill the background between the Fibonacci levels and the bands with customizable colors. This makes it easier to visually highlight key zones on the chart.
How the Indicator Works:
AdvancedLines (FiboBands) - PaSKaL calculates the range (difference between the highest high and the lowest low) over a user-defined number of bars (e.g., 300). Fibonacci levels are derived from this range, helping traders identify potential price reversal points.
Mathematical Basis :
Fibonacci retracement levels are based on the Fibonacci sequence, where each number is the sum of the previous two (0, 1, 1, 2, 3, 5, 8, 13, etc.). The ratios derived from this sequence (such as 0.618 and 0.382) have been widely observed in nature, market cycles, and price movements. These ratios are used to forecast potential price retracements or continuation points after a major price move.
Fibonacci Levels Calculation :
Identify the Range: The highest high and the lowest low over the defined period are calculated.
Apply Fibonacci Ratios: Fibonacci ratios (0.236, 0.382, 0.5, 0.618, and 0.764) are applied to this range to calculate the corresponding price levels.
Plot the Levels: The indicator automatically plots these levels on your chart.
Customizing Fibonacci Levels & Colors:
The "AdvancedLines (FiboBands) - PaSKaL" indicator offers various customization options for Fibonacci levels, colors, and visibility:
Fibonacci Level Ratios:
- You can customize the Fibonacci level ratios through the following inputs:
- Fibo Level 1: 0.764
- Fibo Level 2: 0.618
- Fibo Level 3: 0.5
- Fibo Level 4: 0.382
- Fibo Level 5: 0.236
- These levels determine key areas where price may reverse or pause. You can adjust these ratios based on your trading preferences.
Fibonacci Level Colors:
- Each Fibonacci level can be assigned a different color to make it more distinguishable on your chart:
- Fibo Level 1 Color (default: Yellow)
- Fibo Level 2 Color (default: Orange)
- Fibo Level 3 Color (default: Green)
- Fibo Level 4 Color (default: Red)
- Fibo Level 5 Color (default: Blue)
- You can change these colors to fit your visual preferences or to align with your existing chart themes.
Visibility of Fibonacci Levels:
- You can choose whether to display each Fibonacci level using the following visibility inputs:
- Show Fibo Level 1 (0.764): Display or hide this level.
- Show Fibo Level 2 (0.618): Display or hide this level.
- Show Fibo Level 3 (0.5): Display or hide this level.
- Show Fibo Level 4 (0.382): Display or hide this level.
- Show Fibo Level 5 (0.236): Display or hide this level.
- This allows you to customize the indicator according to the specific Fibonacci levels that are most relevant to your trading strategy.
Background Fill Color
- The background between the Fibonacci levels and price bands can be filled with customizable colors:
- Fill Color for Upper Band & Fibo Level 1: This color will fill the area between the upper band and Fibonacci Level 1.
- Fill Color for Lower Band & Fibo Level 5: This color will fill the area between the lower band and Fibonacci Level 5.
- Adjusting these colors helps highlight critical zones where price may reverse or consolidate.
How to Use AdvancedLines (FiboBands) - PaSKaL in Trading :
Range Trading :
Range traders typically buy at support and sell at resistance. Fibonacci levels provide excellent support and resistance zones in a ranging market.
Example: If price reaches the 0.618 level in an uptrend, it may reverse, providing an opportunity to sell.
Conversely, if price drops to the 0.382 level, a bounce might occur, and traders can buy, anticipating the market will stay within the range.
Trend-following Trading :
For trend-following traders, Fibonacci levels act as potential entry points during a retracement. After a strong trend, price often retraces to one of the Fibonacci levels before continuing in the direction of the trend.
Example: In a bullish trend, when price retraces to the 0.382 level, it could be a signal to buy, as the price might resume its upward movement after the correction.
In a bearish trend, retracements to levels like 0.618 or 0.764 could provide optimal opportunities for shorting as the price resumes its downward movement.
Scalping :
Scalpers focus on short-term price movements. Fibonacci levels can help identify precise entry and exit points for quick trades.
Example: If price is fluctuating in a narrow range, a scalper can enter a buy trade at 0.236 and exit at the next Fibonacci level, such as 0.382 or 0.5, capturing small but consistent profits.
Stop-Loss and Take-Profit Levels :
Fibonacci levels can also help in setting stop-loss and take-profit levels.
Example: In a bullish trend, you can set a stop-loss just below the 0.236 level and a take-profit at 0.618.
In a bearish trend, set the stop-loss just above the 0.382 level and the take-profit at 0.764.
Identifying Reversals and Continuations :
Reversals: When price reaches a Fibonacci level and reverses direction, it may indicate the end of a price move.
Trend Continuation: If price bounces off a Fibonacci level and continues in the same direction, this may signal that the trend is still intact.
Conclusion :
AdvancedLines (FiboBands) - PaSKaL is an essential tool for any trader who uses Fibonacci retracements in their trading strategy. By automatically plotting key Fibonacci levels, this indicator helps traders quickly identify support and resistance zones, forecast potential reversals, and make more informed trading decisions.
For Trend-following Traders: Use Fibonacci levels to find optimal entry points after a price retracement.
For Range Traders: Identify key levels where price is likely to reverse or bounce within a range.
For Scalpers: Pinpoint small price movements and take advantage of quick profits by entering and exiting trades at precise Fibonacci levels.
By incorporating AdvancedLines (FiboBands) - PaSKaL into your trading setup, you will gain a deeper understanding of price action, improve your decision-making process, and enhance your overall trading performance.

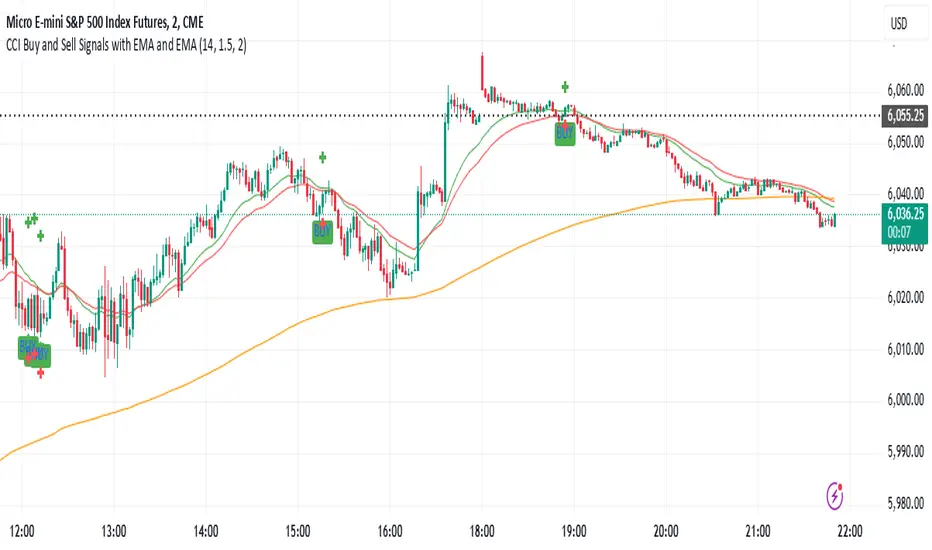
CCI Buy and Sell Signals with 20/30 EMACCI Buy and Sell Signals with EMA and ATR Stop Loss/Take Profit
This indicator is designed to identify buy and sell signals based on a combination of the Commodity Channel Index (CCI) and Exponential Moving Averages (EMA). It also includes an optional ATR-based stop loss and take profit system, which is useful for traders who want to manage their trades with dynamic risk levels.
Features:
CCI Buy and Sell Signals:
Buy Signal: A buy signal is triggered when the CCI crosses up through -100 (from an oversold condition), the 20-period EMA is above the 30-period EMA, and the price is above the 200-period EMA. This suggests that the market is entering an upward trend.
Sell Signal: A sell signal is triggered when the CCI crosses down through +100 (from an overbought condition), the 20-period EMA is below the 30-period EMA, and the price is below the 200-period EMA. This suggests that the market is entering a downward trend.
Exponential Moving Averages (EMA):
The script plots three EMAs:
20-period EMA (Green): Used to identify short-term trends.
30-period EMA (Red): Used to capture medium-term trends.
200-period EMA (Orange): A long-term trend filter, with the price above it generally indicating bullish conditions and below it indicating bearish conditions.
ATR-Based Stop Loss and Take Profit:
Optional Feature: The ATR (Average True Range) indicator can be used to set stop loss and take profit levels based on market volatility.
Stop Loss: Set at a multiple of the ATR below the entry price for long positions and above the entry price for short positions.
Take Profit: Set at a multiple of the ATR above the entry price for long positions and below the entry price for short positions.
Customizable: You can adjust the ATR length, Stop Loss Multiplier, and Take Profit Multiplier through the settings.
Dots: The stop loss and take profit levels are plotted as dots on the chart when the ATR feature is enabled.
Alert Conditions:
Buy Signal Alert: Triggered when a buy signal occurs based on CCI crossing up -100 and other conditions being met.
Sell Signal Alert: Triggered when a sell signal occurs based on CCI crossing down +100 and other conditions being met.
Any Signal Alert: This is a combined alert that triggers for either a buy or sell signal. It helps you stay updated on both types of signals simultaneously.
How to Use:
The indicator will plot buy and sell arrows on the chart, giving clear entry points for trades based on CCI and EMA conditions.
The ATR stop loss and take profit dots (when enabled) provide automatic risk management levels, adjusting dynamically with market volatility.
Traders can customize the ATR settings to fine-tune their stop loss and take profit levels, making this strategy adaptable to different trading styles and market conditions.
Reversal rehersal v1This indicator was designed to identify potential market reversal zones using a combination of RSI thresholds (shooting range/falling range), candlestick patterns, and Fair Value Gaps (FVGs). By combining all these elements into one indicator, it allow for outputting high probability buy/sell signals for use by scalpers on low timeframes like 1-15 mins, for quick but small profits.
Note: that this has been mainly tested on DE40 index on the 1 min timeframe, and need to be adjusted to whichever timeframe and symbol you intend to use. Refer to the backtester feature for checking if this indicator may work for you.
The indicator use RSI ranges from two timeframes to highlight where momentum is building up. During these areas, it will look for certain candlestick patterns (Sweeps as the primary one) and check for existance of fair value gaps to further enhance the hitrate of the signal.
The logic for FVG detection was based on ©pmk07's work with MTF FVG tiny indicator. Several major changes was implemented though and incorporated into this indicator. Among these are:
Automatically adjustments of FVG boxes when mitigated partially and options to extend/cull boxes for performance and clarity.
Backtesting Table (Experimental):
This indicator also features an optional simplified table to review historical theoretical performance of signals, including win rate, profit/loss, and trade statistics. This does not take commision or slippage into consideration.
Usage Notes:
Setup:
1. Add the indicator to your chart.
2. Decide if you want to use Long or Short (or both).
3. If you're scalping on ie. 1 min time frame, make sure to set FVG's to higher timeframes (ie. 5, 15, 60).
4. Enable the 'Show backtest results' and adjust the 'Signals' og 'Take profit' and 'Stop loss' values until you are satisfied with the results.
Use:
1. Setup an alert based on either of the 'BullishShooting range' or 'BearishFalling range' alerts. This will draw your attention to watch for the possible setups.
2. Verify if there's a significant imbalance prior to the signal before taking the trade. Otherwise this may invalidate the setup.
3. Once a signal is shown on the graph (either Green arrow up for buys/Red arrow down for sells) - you should enter a trade with the given 'Take profit' and 'Stop loss' values.
4. (optional) Setup an alert for either the Strong/Weak signals. Which corresponds to when one of the arrows are printed.
Important: This is the way I use it myself, but use at own risk and remember to combine with other indicators for further confluence. Remember this is no crystal ball and I do not guarantee profitable results. The indicator merely show signals with high probability setups for scalping.

SMA + RSI + Volume + ATR StrategySMA + RSI + Volume + ATR Strategy
1. Indicators Used:
SMA (Simple Moving Average): This is a trend-following indicator that calculates the average price of a security over a specified period (50 periods in this case). It's used to identify the overall trend of the market.
RSI (Relative Strength Index): This measures the speed and change of price movements. It tells us if the market is overbought (too high) or oversold (too low). Overbought is above 70 and oversold is below 30.
Volume: This is the amount of trading activity. A higher volume often indicates strong interest in a particular price move.
ATR (Average True Range): This measures volatility, or how much the price is moving in a given period. It helps us adjust stop losses and take profits based on market volatility.
2. Conditions for Entering Trades:
Buy Signal (Green Up Arrow):
Price is above the 50-period SMA (indicating an uptrend).
RSI is below 30 (indicating the market might be oversold or undervalued, signaling a potential reversal).
Current volume is higher than average volume (indicating strong interest in the move).
ATR is increasing (indicating higher volatility, suggesting that the market might be ready for a move).
Sell Signal (Red Down Arrow):
Price is below the 50-period SMA (indicating a downtrend).
RSI is above 70 (indicating the market might be overbought or overvalued, signaling a potential reversal).
Current volume is higher than average volume (indicating strong interest in the move).
ATR is increasing (indicating higher volatility, suggesting that the market might be ready for a move).
3. Take Profit & Stop Loss:
Take Profit: When a trade is made, the strategy will set a target price at a certain percentage above or below the entry price (1.5% in this case) to automatically exit the trade once that target is hit.
Stop Loss: If the price goes against the position, a stop loss is set at a percentage below or above the entry price (0.5% in this case) to limit losses.
4. Execution of Trades:
When the buy condition is met, the strategy will enter a long position (buying).
When the sell condition is met, the strategy will enter a short position (selling).
5. Visual Representation:
Green Up Arrow: Appears on the chart when the buy condition is met.
Red Down Arrow: Appears on the chart when the sell condition is met.
These arrows help you see at a glance when the strategy suggests you should buy or sell.
In Summary:
This strategy uses a combination of trend-following (SMA), momentum (RSI), volume, and volatility (ATR) to decide when to buy or sell a stock. It looks for opportunities when the market is either oversold (buy signal) or overbought (sell signal) and makes sure there’s enough volume and volatility to back up the move. It also includes take-profit and stop-loss levels to manage risk.

Mean Reversion Pro Strategy [tradeviZion]Mean Reversion Pro Strategy : User Guide
A mean reversion trading strategy for daily timeframe trading.
Introduction
Mean Reversion Pro Strategy is a technical trading system that operates on the daily timeframe. The strategy uses a dual Simple Moving Average (SMA) system combined with price range analysis to identify potential trading opportunities. It can be used on major indices and other markets with sufficient liquidity.
The strategy includes:
Trading System
Fast SMA for entry/exit points (5, 10, 15, 20 periods)
Slow SMA for trend reference (100, 200 periods)
Price range analysis (20% threshold)
Position management rules
Visual Elements
Gradient color indicators
Three themes (Dark/Light/Custom)
ATR-based visuals
Signal zones
Status Table
Current position information
Basic performance metrics
Strategy parameters
Optional messages
📊 Strategy Settings
Main Settings
Trading Mode
Options: Long Only, Short Only, Both
Default: Long Only
Position Size: 10% of equity
Starting Capital: $20,000
Moving Averages
Fast SMA: 5, 10, 15, or 20 periods
Slow SMA: 100 or 200 periods
Default: Fast=5, Slow=100
🎯 Entry and Exit Rules
Long Entry Conditions
All conditions must be met:
Price below Fast SMA
Price below 20% of current bar's range
Price above Slow SMA
No existing position
Short Entry Conditions
All conditions must be met:
Price above Fast SMA
Price above 80% of current bar's range
Price below Slow SMA
No existing position
Exit Rules
Long Positions
Exit when price crosses above Fast SMA
No fixed take-profit levels
No stop-loss (mean reversion approach)
Short Positions
Exit when price crosses below Fast SMA
No fixed take-profit levels
No stop-loss (mean reversion approach)
💼 Risk Management
Position Sizing
Default: 10% of equity per trade
Initial capital: $20,000
Commission: 0.01%
Slippage: 2 points
Maximum one position at a time
Risk Control
Use daily timeframe only
Avoid trading during major news events
Consider market conditions
Monitor overall exposure
📊 Performance Dashboard
The strategy includes a comprehensive status table displaying:
Strategy Parameters
Current SMA settings
Trading direction
Fast/Slow SMA ratio
Current Status
Active position (Flat/Long/Short)
Current price with color coding
Position status indicators
Performance Metrics
Net Profit (USD and %)
Win Rate with color grading
Profit Factor with thresholds
Maximum Drawdown percentage
Average Trade value
📱 Alert Settings
Entry Alerts
Long Entry (Buy Signal)
Short Entry (Sell Signal)
Exit Alerts
Long Exit (Take Profit)
Short Exit (Take Profit)
Alert Message Format
Strategy name
Signal type and direction
Current price
Fast SMA value
Slow SMA value
💡 Usage Tips
Consider starting with Long Only mode
Begin with default settings
Keep track of your trades
Review results regularly
Adjust settings as needed
Follow your trading plan
⚠️ Disclaimer
This strategy is for educational and informational purposes only. It is not financial advice. Always:
Conduct your own research
Test thoroughly before live trading
Use proper risk management
Consider your trading goals
Monitor market conditions
Never risk more than you can afford to lose
📋 Release Notes
14 January 2025
Added New Fast & Slow SMA Options:
Fibonacci-based periods: 8, 13, 21, 144, 233, 377
Additional period: 50
Complete Fast SMA options now: 5, 8, 10, 13, 15, 20, 21, 34, 50
Complete Slow SMA options now: 100, 144, 200, 233, 377
Bug Fixes:
Fixed Maximum Drawdown calculation in the performance table
Now using strategy.max_drawdown_percent for accurate DD reporting
Previous version showed incorrect DD values
Performance metrics now accurately reflect trading results
Performance Note:
Strategy tested with Fast/Slow SMA 13/377
Test conducted with 10% equity risk allocation
Daily Timeframe
For Beginners - How to Modify SMA Levels:
Find this line in the code:
fastLength = input.int(title="Fast SMA Length", defval=5, options= )
To add a new Fast SMA period: Add the number to the options list, e.g.,
To remove a Fast SMA period: Remove the number from the options list
For Slow SMA, find:
slowLength = input.int(title="Slow SMA Length", defval=100, options= )
Modify the options list the same way
⚠️ Note: Keep the periods that make sense for your trading timeframe
💡 Tip: Test any new combinations thoroughly before live trading
"Trade with Discipline, Manage Risk, Stay Consistent" - tradeviZion

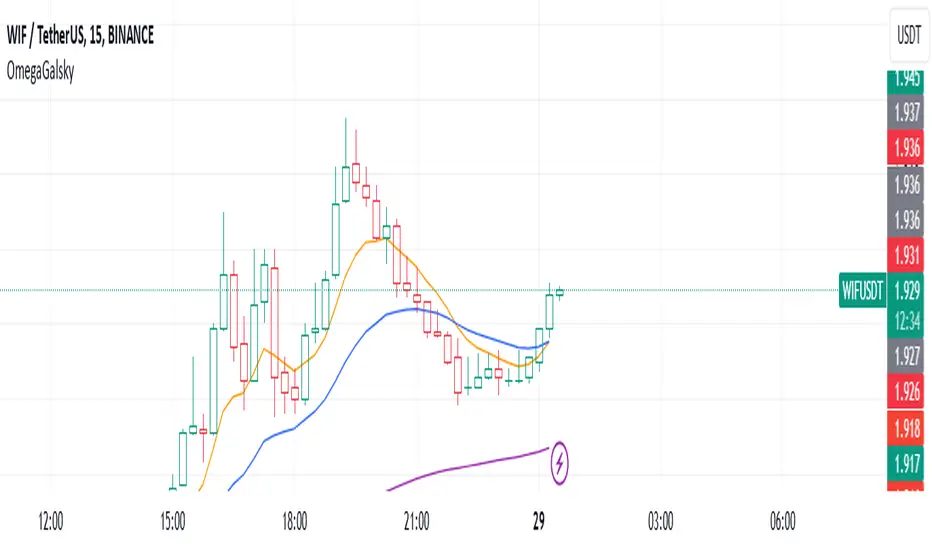
Omega_galskyThe strategy uses three Exponential Moving Averages (EMAs) — EMA8, EMA21, and EMA89 — to decide when to open buy or sell trades. It also includes a mechanism to move the Stop Loss (SL) to the Break-Even (BE) point, which is the entry price, once the price reaches a Risk-to-Reward (R2R) ratio of 1:1.
Key Steps:
Calculating EMAs: The script computes the EMA values for the specified periods. These help identify market trends and potential entry points.
Buy Conditions:
EMA8 crosses above EMA21.
The candle that causes the crossover is green (closing price is higher than the opening price).
The closing price is above EMA89.
If all conditions are met, a buy order is executed.
Sell Conditions:
EMA8 crosses below EMA21.
The candle that causes the crossover is red (closing price is lower than the opening price).
The closing price is below EMA89.
If all conditions are met, a sell order is executed.
Stop Loss and Take Profit:
Initial Stop Loss and Take Profit levels are calculated based on the entry price and a percentage defined by the user.
These levels help protect against large losses and lock in profits.
Break-Even Logic:
When the price moves favorably to reach a 1:1 R2R ratio:
For a buy trade, the Stop Loss is moved to the entry price if the price increases sufficiently.
For a sell trade, the Stop Loss is moved to the entry price if the price decreases sufficiently.
This ensures the trade is risk-free after the price reaches the predefined level.
Visual Representation:
The EMAs are plotted on the chart for easy visualization of trends and crossovers.
Entry and exit points are also marked on the chart to track trades.
Purpose:
The strategy is designed to capitalize on EMA crossovers while minimizing risks using Break-Even logic and predefined Stop Loss/Take Profit levels. It automates decision-making for trend-following traders and ensures disciplined risk management.
HOD/LOD/PMH/PML/PDH/PDL Strategy by @tradingbauhaus This script is a trading strategy @tradingbauhaus designed to trade based on key price levels, such as the High of Day (HOD), Low of Day (LOD), Premarket High (PMH), Premarket Low (PML), Previous Day High (PDH), and Previous Day Low (PDL). Below, I’ll explain in detail what the script does:
Core Functionality of the Script:
Calculates Key Price Levels:
HOD (High of Day): The highest price of the current day.
LOD (Low of Day): The lowest price of the current day.
PMH (Premarket High): The highest price during the premarket session (before the market opens).
PML (Premarket Low): The lowest price during the premarket session.
PDH (Previous Day High): The highest price of the previous day.
PDL (Previous Day Low): The lowest price of the previous day.
Draws Horizontal Lines on the Chart:
Plots horizontal lines on the chart for each key level (HOD, LOD, PMH, PML, PDH, PDL) with specific colors for easy visual identification.
Defines Entry and Exit Rules:
Long Entry (Buy): If the price crosses above the PMH (Premarket High) or the PDH (Previous Day High).
Short Entry (Sell): If the price crosses below the PML (Premarket Low) or the PDL (Previous Day Low).
Long Exit: If the price reaches the HOD (High of Day) during a long position.
Short Exit: If the price reaches the LOD (Low of Day) during a short position.
How the Script Works Step by Step:
Calculates Key Levels:
Uses the request.security function to fetch the HOD and LOD of the current day, as well as the highs and lows of the previous day (PDH and PDL).
Calculates the PMH and PML during the premarket session (before 9:30 AM).
Plots Levels on the Chart:
Uses the plot function to draw horizontal lines on the chart representing the key levels (HOD, LOD, PMH, PML, PDH, PDL).
Each level has a specific color for easy identification:
HOD: White.
LOD: Purple.
PDH: Orange.
PDL: Blue.
PMH: Green.
PML: Red.
Defines Trading Rules:
Uses conditions with ta.crossover and ta.crossunder to detect when the price crosses key levels.
Long Entry: If the price crosses above the PMH or PDH, a long position (buy) is opened.
Short Entry: If the price crosses below the PML or PDL, a short position (sell) is opened.
Long Exit: If the price reaches the HOD during a long position, the position is closed.
Short Exit: If the price reaches the LOD during a short position, the position is closed.
Executes Orders Automatically:
Uses the strategy.entry and strategy.close functions to open and close positions automatically based on the defined rules.
Advantages of This Strategy:
Based on Key Levels: Uses important price levels that often act as support and resistance.
Easy to Visualize: Horizontal lines on the chart make it easy to identify levels.
Automated: Entries and exits are executed automatically based on the defined rules.
Limitations of This Strategy:
Dependent on Volatility: Works best in markets with significant price movements.
False Crosses: There may be false crosses that generate incorrect signals.
No Advanced Risk Management: Does not include dynamic stop-loss or take-profit mechanisms.
How to Improve the Strategy:
Add Stop-Loss and Take-Profit: To limit losses and lock in profits.
Filter Signals with Indicators: Use RSI, MACD, or other indicators to confirm signals.
Optimize Levels: Adjust key levels based on the asset’s behavior.
In summary, this script is a trading strategy that operates based on key price levels, such as HOD, LOD, PMH, PML, PDH, and PDL. It is useful for traders who want to trade based on significant support and resistance levels.

IU Opening range Breakout StrategyIU Opening Range Breakout Strategy
This Pine Script strategy is designed to capitalize on the breakout of the opening range, which is a popular trading approach. The strategy identifies the high and low prices of the opening session and takes trades based on price crossing these levels, with built-in risk management and trade limits for intraday trading.
Key Features:
1. Risk Management:
- Risk-to-Reward Ratio (RTR):
Set a customizable risk-to-reward ratio to calculate target prices based on stop-loss levels.
Default: 2:1
- Max Trades in a Day:
Specify the maximum number of trades allowed per day to avoid overtrading.
Default: 2 trades in a day.
- End-of-Day Close:
Automatically closes all open positions at a user-defined session end time to ensure no overnight exposure.
Default: 3:15 PM
2. Opening Range Identification
- Opening Range High and Low:
The script detects the high and low of the first trading session using Pine Script's session functions.
These levels are plotted as visual guides on the chart:
- High: Lime-colored circles.
- Low: Red-colored circles.
3. Trade Entry Logic
- Long Entry:
A long trade is triggered when the price closes above the opening range high.
- Entry condition: Crossover of the price above the opening range high.
-Short Entry:
A short trade is triggered when the price closes below the opening range low.
- Entry condition: Crossunder of the price below the opening range low.
Both entries are conditional on the absence of an existing position.
4. Stop Loss and Take Profit
- Long Position:
- Stop Loss: Previous candle's low.
- Take Profit: Calculated based on the RTR.
- **Short Position:**
- **Stop Loss:** Previous candle's high.
- **Take Profit:** Calculated based on the RTR.
The strategy plots these levels for visual reference:
- Stop Loss: Red dashed lines.
- Take Profit: Green dashed lines.
5. Visual Enhancements
-Trade Level Highlighting:
The script dynamically shades the areas between the entry price and SL/TP levels:
- Red shading for the stop-loss region.
- Green shading for the take-profit region.
- Entry Price Line:
A silver-colored line marks the average entry price for active trades.
How to Use:
1.Input Configuration:
Adjust the Risk-to-Reward ratio, max trades per day, and session end time to suit your trading preferences.
2.Visual Cues:
Use the opening range high/low lines and shading to identify potential breakout opportunities.
3.Execution:
The strategy will automatically enter and exit trades based on the conditions. Review the plotted SL and TP levels to monitor the risk-reward setup.
Important Notes:
- This strategy is designed for intraday trading and works best in markets with high volatility during the opening session.
- Backtest the strategy on your preferred market and timeframe to ensure compatibility.
- Proper risk management and position sizing are essential when using this strategy in live markets.

ATR-based TP/SL with Dynamic RREnglish
This indicator combines the power of the Average True Range (ATR) with dynamic calculations for Take Profit (TP) and Stop Loss (SL) levels, offering a clear visualization of trading opportunities and their respective Risk-Reward Ratios (RRR).
Features:
Dynamic TP/SL Calculation:
TP and SL levels are derived using user-defined ATR multipliers for precise positioning.
Multipliers are flexible, allowing traders to adjust according to their strategies.
Risk-Reward Ratio (RRR):
Automatically calculates and displays the RRR for each trade signal.
Helps traders quickly assess if a trade aligns with their risk management plan.
Entry Conditions:
Buy signals occur when the closing price crosses above the 20-period Simple Moving Average (SMA).
Sell signals occur when the closing price crosses below the 20-period SMA.
Visual Aids:
Red and green lines indicate Stop Loss and Take Profit levels.
Blue and orange labels show the RRR for long and short trades, respectively.
How It Works:
The indicator uses the ATR to calculate TP and SL levels:
TP: Adjusted based on the desired Risk-Reward Ratio (RR).
SL: Proportional to the ATR multiplier.
Entry signals are plotted with "BUY" or "SELL" markers, while the respective TP/SL levels are drawn as horizontal lines.
Why Use This Indicator?
Perfect for traders who value precise risk management.
Helps identify trades with favorable RRR (e.g., greater than 1.5 or 2.0).
Ideal for swing traders, day traders, and scalpers looking to automate their decision-making process.
Customization:
ATR Length: Control the sensitivity of ATR-based calculations.
ATR Multipliers: Set the TP and SL distances relative to the ATR.
Desired RRR: Define the risk/reward ratio you aim to achieve.
Important Notes:
The indicator does not place trades automatically; it is for visual and analytical purposes.
Always backtest and combine it with additional analysis for best results.
French
Cet indicateur combine la puissance de l’Average True Range (ATR) avec des calculs dynamiques pour les niveaux de Take Profit (TP) et de Stop Loss (SL), tout en offrant une visualisation claire des opportunités de trading et de leurs Ratios Risque/Rendement (RRR).
Fonctionnalités :
Calcul Dynamique des TP/SL :
Les niveaux de TP et SL sont calculés à l'aide de multiplicateurs ATR définis par l’utilisateur pour une position précise.
Les multiplicateurs sont personnalisables pour s'adapter à votre stratégie de trading.
Ratio Risque/Rendement (RRR) :
Calcule et affiche automatiquement le ratio RRR pour chaque signal de trade.
Permet aux traders d’évaluer rapidement si un trade correspond à leur plan de gestion des risques.
Conditions d'Entrée :
Les signaux d'achat apparaissent lorsque le prix de clôture traverse au-dessus de la moyenne mobile simple (SMA) à 20 périodes.
Les signaux de vente apparaissent lorsque le prix de clôture traverse en dessous de la SMA à 20 périodes.
Aides Visuelles :
Lignes rouges et vertes pour indiquer les niveaux de Stop Loss et de Take Profit.
Étiquettes bleues et orange pour afficher le RRR des trades longs et courts, respectivement.
Comment Cela Fonctionne :
L'indicateur utilise l’ATR pour calculer les niveaux TP et SL :
TP : Calculé dynamiquement en fonction du ratio risque/rendement souhaité (RRR).
SL : Proportionnel au multiplicateur ATR défini par l’utilisateur.
Les signaux d’entrée sont représentés par des étiquettes "BUY" ou "SELL", tandis que les niveaux de TP/SL sont tracés sous forme de lignes horizontales.
Pourquoi Utiliser Cet Indicateur ?
Idéal pour les traders soucieux d’une gestion rigoureuse des risques.
Identifie les opportunités de trades avec des RRR favorables (par exemple, supérieurs à 1.5 ou 2.0).
Convient aux swing traders, day traders et scalpeurs souhaitant automatiser leur processus de décision.
Personnalisation :
Longueur de l’ATR : Contrôlez la sensibilité des calculs basés sur l’ATR.
Multiplicateurs ATR : Ajustez les distances TP et SL par rapport à l’ATR.
Ratio RRR souhaité : Définissez le ratio risque/rendement que vous visez.
Remarques Importantes :
Cet indicateur n’exécute pas de trades automatiquement ; il est destiné à un usage visuel et analytique uniquement.
Toujours backtester et combiner avec une analyse supplémentaire pour de meilleurs résultats.
parametre par type de trading:
1. Pour les Scalpers :
Style de trading : Trades rapides sur de petites variations de prix, souvent sur des unités de temps courtes (1 min, 5 min).
Recommandations de paramètres :
ATR Length : 7 (plus court pour réagir rapidement à la volatilité).
Multiplicateur SL : 1.0 (Stop Loss proche pour limiter les pertes).
RR souhaité : 1.5 à 2.0 (bon équilibre entre risque et récompense).
Résultat attendu : Des trades fréquents, avec une probabilité raisonnable de toucher le TP tout en limitant les pertes.
2. Pour les Day Traders :
Style de trading : Trades qui durent plusieurs heures dans la journée, souvent sur des unités de temps moyennes (15 min, 1h).
Recommandations de paramètres :
ATR Length : 14 (standard pour capturer une volatilité modérée).
Multiplicateur SL : 1.5 (Stop Loss à distance raisonnable pour supporter les fluctuations intrajournalières).
RR souhaité : 2.0 à 3.0 (ciblez une bonne récompense par rapport au risque).
Résultat attendu : Moins de trades, mais un RR élevé pour compenser les pertes potentielles.
3. Pour les Swing Traders :
Style de trading : Trades qui durent plusieurs jours, souvent sur des unités de temps longues (4h, 1 jour).
Recommandations de paramètres :
ATR Length : 20 (pour capturer des mouvements de volatilité plus larges).
Multiplicateur SL : 2.0 (Stop Loss large pour supporter des fluctuations importantes).
RR souhaité : 3.0 ou plus (ciblez de gros mouvements de prix).
Résultat attendu : Des trades moins fréquents mais potentiellement très lucratifs.
4. Pour les Actifs Volatils (Crypto, Commodités) :
Problème spécifique : Les actifs volatils ont souvent des mouvements brusques.
Recommandations de paramètres :
ATR Length : 7 ou 10 (plus court pour suivre rapidement les variations).
Multiplicateur SL : 1.5 à 2.0 (assez large pour ne pas être déclenché prématurément).
RR souhaité : 1.5 à 2.0 (favorisez des récompenses réalistes sur des mouvements volatils).
Résultat attendu : Trades qui s’adaptent à la volatilité sans sortir trop tôt.
5. Pour les Marchés Stables (Indices, Actions Blue Chip) :
Problème spécifique : Les mouvements sont souvent lents et prévisibles.
Recommandations de paramètres :
ATR Length : 14 ou 20 (capture une volatilité modérée).
Multiplicateur SL : 1.0 à 1.5 (Stop Loss serré pour maximiser l’efficacité).
RR souhaité : 2.0 à 3.0 (ciblez des ratios plus élevés sur des mouvements moins fréquents).
Résultat attendu : Maximisation des profits sur des tendances claires.
Recommandation Générale :
Si vous ne savez pas par où commencer, utilisez ces paramètres par défaut :
ATR Length : 14
Multiplicateur SL : 1.5
RR souhaité : 2.0

Dual Strategy Selector V2 - CryptogyaniOverview:
This script provides traders with a dual-strategy system that they can toggle between using a simple dropdown menu in the input settings. It is designed to cater to different trading styles and needs, offering both simplicity and advanced filtering techniques. The strategies are built around moving average crossovers, enhanced by configurable risk management tools like take profit levels, trailing stops, and ATR-based stop-loss.
Key Features:
Two Strategies in One Script:
Strategy 1: A classic moving average crossover strategy for identifying entry signals based on trend reversals. Includes user-defined take profit and trailing stop-loss options for profit locking.
Strategy 2: An advanced trend-following system that incorporates:
A higher timeframe trend filter to confirm entry signals.
ATR-based stop-loss for dynamic risk management.
Configurable partial take profit to secure gains while letting the trade run.
Highly Customizable:
All key parameters such as SMA lengths, take profit levels, ATR multiplier, and timeframe for the trend filter are adjustable via the input settings.
Dynamic Toggle:
Traders can switch between Strategy 1 and Strategy 2 with a single dropdown, allowing them to adapt the strategy to market conditions.
How It Works:
Strategy 1:
Entry Logic: A long trade is triggered when the fast SMA crosses above the slow SMA.
Exit Logic: The trade exits at either a user-defined take profit level (percentage or pips) or via an optional trailing stop that dynamically adjusts based on price movement.
Strategy 2:
Entry Logic: Builds on the SMA crossover logic but adds a higher timeframe trend filter to align trades with the broader market direction.
Risk Management:
ATR-Based Stop-Loss: Protects against adverse moves with a volatility-adjusted stop-loss.
Partial Take Profit: Allows traders to secure a percentage of gains while keeping some exposure for extended trends.
How to Use:
Select Your Strategy:
Use the dropdown in the input settings to choose Strategy 1 or Strategy 2.
Configure Parameters:
Adjust SMA lengths, take profit, and risk management settings to align with your trading style.
For Strategy 2, specify the higher timeframe for trend filtering.
Deploy and Monitor:
Apply the script to your preferred asset and timeframe.
Use the backtest results to fine-tune settings for optimal performance.
Why Choose This Script?:
This script stands out due to its dual-strategy flexibility and enhanced features:
For beginners: Strategy 1 provides a simple yet effective trend-following system with minimal setup.
For advanced traders: Strategy 2 includes powerful tools like trend filters and ATR-based stop-loss, making it ideal for challenging market conditions.
By combining simplicity with advanced features, this script offers something for everyone while maintaining full transparency and user customization.
Default Settings:
Strategy 1:
Fast SMA: 21, Slow SMA: 49
Take Profit: 7% or 50 pips
Trailing Stop: Optional (disabled by default)
Strategy 2:
Fast SMA: 20, Slow SMA: 50
ATR Multiplier: 1.5
Partial Take Profit: 50%
Higher Timeframe: 1 Day (1D)

Dynamic TestingInput Parameters
`lookbackPeriod` : Number of candles to check for determining the highest high (resistance) and lowest low (support) levels.
`atrPeriod` : The period for calculating the Average True Range (ATR), a measure of market volatility.
`atrMultiplierSL` : Multiplier to calculate the stop-loss distance relative to the ATR.
`atrMultiplierTP1` and `atrMultiplierTP2` : Multipliers to calculate two take-profit levels relative to ATR.
`rewardToRisk` : The ratio between reward (profit) and risk (stop loss) for trade management.
---
Core Calculations
ATR (Average True Range)
atr = ta.atr(atrPeriod)
ATR is computed using the specified period to gauge price volatility.
Volume SMA
volumeSMA = ta.sma(volume, atrPeriod)
The script calculates the simple moving average of volume over the same period as ATR. This is used as a threshold for validating high-volume scenarios.
---
Support and Resistance Levels
`support` : Lowest price over the last `lookbackPeriod` candles.
`resistance` : Highest price over the same period.
`supportBuffer` and `resistanceBuffer` : These are "buffered" zones around support and resistance, calculated using half of the ATR to prevent false breakouts.
---
Entry Scenarios
Bullish Entry (`isBullishEntry`)
The close is above the buffered support level.
The low of the current candle touches or breaks below the support level.
The trading volume is greater than the `volumeSMA`.
Bearish Entry (`isBearishEntry`)
The close is below the buffered resistance level.
The high of the current candle touches or exceeds the resistance level.
The trading volume is greater than the `volumeSMA`.
---
Box Visualization
Bullish and Bearish Boxes
Bullish Box (`bullishBox`):
- A green, semi-transparent rectangle around the support level to highlight the bullish entry zone.
- Dynamically updates based on recent price action.
Bearish Box (`bearishBox`):
- A red, semi-transparent rectangle around the resistance level to highlight the bearish entry zone.
- Adjusts similarly as price evolves.
---
Stop Loss and Take Profit Calculations
Bullish Trades
Stop Loss (`bullishSL`): Calculated as support - atrMultiplierSL * ATR .
Take Profit 1 (`bullishTP1`): support + rewardToRisk * atrMultiplierTP1 * ATR .
Take Profit 2 (`bullishTP2`): support + rewardToRisk * atrMultiplierTP2 * ATR .
Bearish Trades
Stop Loss (`bearishSL`): resistance + atrMultiplierSL * ATR .
Take Profit 1 (`bearishTP1`): resistance - rewardToRisk * atrMultiplierTP1 * ATR .
Take Profit 2 (`bearishTP2`): resistance - rewardToRisk * atrMultiplierTP2 * ATR .
---
Visualization for Key Levels
Bullish Scenario
Green lines represent `bullishTP1` and `bullishTP2` for profit targets.
A red line indicates the `bullishSL` .
Labels like "TP1," "TP2," and "SL" dynamically appear at respective levels to make the targets and risk visually clear.
Bearish Scenario
Red lines represent `bearishTP1` and `bearishTP2` .
A green line marks the `bearishSL` .
Similar dynamic labeling for `TP1` , `TP2` , and `SL` at corresponding bearish levels.
---
Dynamic Updates
Both the entry boxes and key level visualizations (lines and labels) adjust dynamically based on real-time price and volume data.
---
Purpose
Identify high-probability bullish and bearish trade setups.
Define clear entry zones (using boxes) and exit levels (TP1, TP2, SL).
Incorporate volatility (via ATR) and volume into decision-making.
---
Technical Summary
Dynamically visualize support/resistance levels.
Set risk-managed trades using ATR-based stop-loss and profit levels.
Automate visual trade zones for enhanced chart clarity.
---

Roman's Ranges(GOLD FUTURES)This indicator provides the user with Gold Future's previous day’s range and how long it took for the price to reach its first extreme for the day. This information is used to predict the most probable daily direction trend and estimate how long you should expect to hold your winning trade. The distance and time are based on the market open candle (6:30 am). It measures from the retracement wick of the candle to the last 5m close of the day’s first extreme low or high point. It also includes that distance in pts.
Previous market data does not guarantee future results, however, you can leverage the knowledge of the previous day’s ranges to set reasonable take profit levels and when your target is not met automatically, you know how long it took on the previous day to reach the day’s first low/high. If you are nearing that amount of time and your trade is not as profitable as expected, it is easier to get out with less profits using this estimated time rather than hoping the market closes in your favor.
Markets go through cycles and it can be difficult to trade them all if you have a fault expectation how how far the price is expected to move. Price tends to deviate slowly from the average ranges slightly day after day, but you can expect an average range to prevail throughout the week +/- 3 points. It can be very easy to be stuck on 5-point take-profit levels that you don’t pay attention to the average range being twice or three times that distance. The same can be said for the opposite scenario with having higher profit expectations than reasonably possible.
This indicator and my statements are not financial advice. This is meant for educational purposes only.

Fibonacci ATR Fusion - Strategy [presentTrading]Open-script again! This time is also an ATR-related strategy. Enjoy! :)
If you have any questions, let me know, and I'll help make this as effective as possible.
█ Introduction and How It Is Different
The Fibonacci ATR Fusion Strategy is an advanced trading approach that uniquely integrates Fibonacci-based weighted averages with the Average True Range (ATR) to identify and capitalize on significant market trends.
Unlike traditional strategies that rely on single indicators or static parameters, this method combines multiple timeframes and dynamic volatility measurements to enhance precision and adaptability. Additionally, it features a 4-step Take Profit (TP) mechanism, allowing for systematic profit-taking at various levels, which optimizes both risk management and return potential in long and short market positions.
BTCUSD 6hr Performance
█ Strategy, How It Works: Detailed Explanation
The Fibonacci ATR Fusion Strategy utilizes a combination of technical indicators and weighted averages to determine optimal entry and exit points. Below is a breakdown of its key components and operational logic.
🔶 1. Enhanced True Range Calculation
The strategy begins by calculating the True Range (TR) to measure market volatility accurately.
TR = max(High - Low, abs(High - Previous Close), abs(Low - Previous Close))
High and Low: Highest and lowest prices of the current trading period.
Previous Close: Closing price of the preceding trading period.
max: Selects the largest value among the three calculations to account for gaps and limit movements.
🔶 2. Buying Pressure (BP) Calculation
Buying Pressure (BP) quantifies the extent to which buyers are driving the price upwards within a period.
BP = Close - True Low
Close: Current period's closing price.
True Low: The lower boundary determined in the True Range calculation.
🔶 3. Ratio Calculation for Different Periods
To assess the strength of buying pressure relative to volatility, the strategy calculates a ratio over various Fibonacci-based timeframes.
Ratio = 100 * (Sum of BP over n periods) / (Sum of TR over n periods)
n: Length of the period (e.g., 8, 13, 21, 34, 55).
Sum of BP: Cumulative Buying Pressure over n periods.
Sum of TR: Cumulative True Range over n periods.
This ratio normalizes buying pressure, making it comparable across different timeframes.
🔶 4. Weighted Average Calculation
The strategy employs a weighted average of ratios from multiple Fibonacci-based periods to smooth out signals and enhance trend detection.
Weighted Avg = (w1 * Ratio_p1 + w2 * Ratio_p2 + w3 * Ratio_p3 + w4 * Ratio_p4 + Ratio_p5) / (w1 + w2 + w3 + w4 + 1)
w1, w2, w3, w4: Weights assigned to each ratio period.
Ratio_p1 to Ratio_p5: Ratios calculated for periods p1 to p5 (e.g., 8, 13, 21, 34, 55).
This weighted approach emphasizes shorter periods more heavily, capturing recent market dynamics while still considering longer-term trends.
🔶 5. Simple Moving Average (SMA) of Weighted Average
To further smooth the weighted average and reduce noise, a Simple Moving Average (SMA) is applied.
Weighted Avg SMA = SMA(Weighted Avg, m)
- m: SMA period (e.g., 3).
This smoothed line serves as the primary signal generator for trade entries and exits.
🔶 6. Trading Condition Thresholds
The strategy defines specific threshold values to determine optimal entry and exit points based on crossovers and crossunders of the SMA.
Long Condition = Crossover(Weighted Avg SMA, Long Entry Threshold)
Short Condition = Crossunder(Weighted Avg SMA, Short Entry Threshold)
Long Exit = Crossunder(Weighted Avg SMA, Long Exit Threshold)
Short Exit = Crossover(Weighted Avg SMA, Short Exit Threshold)
Long Entry Threshold (T_LE): Level at which a long position is triggered.
Short Entry Threshold (T_SE): Level at which a short position is triggered.
Long Exit Threshold (T_LX): Level at which a long position is exited.
Short Exit Threshold (T_SX): Level at which a short position is exited.
These conditions ensure that trades are only executed when clear trends are identified, enhancing the strategy's reliability.
Previous local performance
🔶 7. ATR-Based Take Profit Mechanism
When enabled, the strategy employs a 4-step Take Profit system to systematically secure profits as the trade moves in the desired direction.
TP Price_1 Long = Entry Price + (TP1ATR * ATR Value)
TP Price_2 Long = Entry Price + (TP2ATR * ATR Value)
TP Price_3 Long = Entry Price + (TP3ATR * ATR Value)
TP Price_1 Short = Entry Price - (TP1ATR * ATR Value)
TP Price_2 Short = Entry Price - (TP2ATR * ATR Value)
TP Price_3 Short = Entry Price - (TP3ATR * ATR Value)
- ATR Value: Calculated using ATR over a specified period (e.g., 14).
- TPxATR: User-defined multipliers for each take profit level.
- TPx_percent: Percentage of the position to exit at each TP level.
This multi-tiered exit strategy allows for partial position closures, optimizing profit capture while maintaining exposure to potential further gains.
█ Trade Direction
The Fibonacci ATR Fusion Strategy is designed to operate in both long and short market conditions, providing flexibility to traders in varying market environments.
Long Trades: Initiated when the SMA of the weighted average crosses above the Long Entry Threshold (T_LE), indicating strong upward momentum.
Short Trades: Initiated when the SMA of the weighted average crosses below the Short Entry Threshold (T_SE), signaling robust downward momentum.
Additionally, the strategy can be configured to trade exclusively in one direction—Long, Short, or Both—based on the trader’s preference and market analysis.
█ Usage
Implementing the Fibonacci ATR Fusion Strategy involves several steps to ensure it aligns with your trading objectives and market conditions.
1. Configure Strategy Parameters:
- Trading Direction: Choose between Long, Short, or Both based on your market outlook.
- Trading Condition Thresholds: Set the Long Entry, Short Entry, Long Exit, and Short Exit thresholds to define when to enter and exit trades.
2. Set Take Profit Levels (if enabled):
- ATR Multipliers: Define how many ATRs away from the entry price each take profit level is set.
- Take Profit Percentages: Allocate what percentage of the position to close at each TP level.
3. Apply to Desired Chart:
- Add the strategy to the chart of the asset you wish to trade.
- Observe the plotted Fibonacci ATR and SMA Fibonacci ATR indicators for visual confirmation.
4. Monitor and Adjust:
- Regularly review the strategy’s performance through backtesting.
- Adjust the input parameters based on historical performance and changing market dynamics.
5. Risk Management:
- Ensure that the sum of take profit percentages does not exceed 100% to avoid over-closing positions.
- Utilize the ATR-based TP levels to adapt to varying market volatilities, maintaining a balanced risk-reward ratio.
█ Default Settings
Understanding the default settings is crucial for optimizing the Fibonacci ATR Fusion Strategy's performance. Here's a precise and simple overview of the key parameters and their effects:
🔶 Key Parameters and Their Effects
1. Trading Direction (`tradingDirection`)
- Default: Both
- Effect: Determines whether the strategy takes both long and short positions or restricts to one direction. Selecting Both allows maximum flexibility, while Long or Short can be used for directional bias.
2. Trading Condition Thresholds
Long Entry (long_entry_threshold = 58.0): Higher values reduce false positives but may miss trades.
Short Entry (short_entry_threshold = 42.0): Lower values capture early short trends but may increase false signals.
Long Exit (long_exit_threshold = 42.0): Exits long positions early, securing profits but potentially cutting trends short.
Short Exit (short_exit_threshold = 58.0): Delays short exits to capture favorable movements, avoiding premature exits.
3. Take Profit Configuration (`useTakeProfit` = false)
- Effect: When enabled, the strategy employs a 4-step TP mechanism to secure profits at multiple levels. By default, it is disabled to allow users to opt-in based on their trading style.
4. ATR-Based Take Profit Multipliers
TP1 (tp1ATR = 3.0): Sets the first TP at 3 ATRs for initial profit capture.
TP2 (tp2ATR = 8.0): Targets larger trends, though less likely to be reached.
TP3 (tp3ATR = 14.0): Optimizes for extreme price moves, seldom triggered.
5. Take Profit Percentages
TP Level 1 (tp1_percent = 12%): Secures 12% at the first TP.
TP Level 2 (tp2_percent = 12%): Exits another 12% at the second TP.
TP Level 3 (tp3_percent = 12%): Closes an additional 12% at the third TP.
6. Weighted Average Parameters
Ratio Periods: Fibonacci-based intervals (8, 13, 21, 34, 55) balance responsiveness.
Weights: Emphasizes recent data for timely responses to market trends.
SMA Period (weighted_avg_sma_period = 3): Smoothens data with minimal lag, balancing noise reduction and responsiveness.
7. ATR Period (`atrPeriod` = 14)
Effect: Sets the ATR calculation length, impacting TP sensitivity to volatility.
🔶 Impact on Performance
- Sensitivity and Responsiveness:
- Shorter Ratio Periods and Higher Weights: Make the weighted average more responsive to recent price changes, allowing quicker trade entries and exits but increasing the likelihood of false signals.
- Longer Ratio Periods and Lower Weights: Provide smoother signals with fewer false positives but may delay trade entries, potentially missing out on significant price moves.
- Profit Taking:
- ATR Multipliers: Higher multipliers set take profit levels further away, targeting larger price movements but reducing the probability of reaching these levels.
- Fixed Percentages: Allocating equal percentages at each TP level ensures consistent profit realization and risk management, preventing overexposure.
- Trade Direction Control:
- Selecting Specific Directions: Restricting trades to Long or Short can align the strategy with market trends or personal biases, potentially enhancing performance in trending markets.
- Risk Management:
- Take Profit Percentages: Dividing the position into smaller percentages at multiple TP levels helps lock in profits progressively, reducing risk and allowing the remaining position to ride further trends.
- Market Adaptability:
- Weighted Averages and ATR: By combining multiple timeframes and adjusting to volatility, the strategy adapts to different market conditions, maintaining effectiveness across various asset classes and timeframes.
---
If you want to know more about ATR, can also check "SuperATR 7-Step Profit".
Enjoy trading.

XAUUSD 10-Minute StrategyThis XAUUSD 10-Minute Strategy is designed for trading Gold vs. USD on a 10-minute timeframe. By combining multiple technical indicators (MACD, RSI, Bollinger Bands, and ATR), the strategy effectively captures both trend-following and reversal opportunities, with adaptive risk management for varying market volatility. This approach balances high-probability entries with robust volatility management, making it suitable for traders seeking to optimise entries during significant price movements and reversals.
Key Components and Logic:
MACD (12, 26, 9):
Generates buy signals on MACD Line crossovers above the Signal Line and sell signals on crossovers below the Signal Line, helping to capture momentum shifts.
RSI (14):
Utilizes oversold (below 35) and overbought (above 65) levels as a secondary filter to validate entries and avoid overextended price zones.
Bollinger Bands (20, 2):
Uses upper and lower Bollinger Bands to identify potential overbought and oversold conditions, aiming to enter long trades near the lower band and short trades near the upper band.
ATR-Based Stop Loss and Take Profit:
Stop Loss and Take Profit levels are dynamically set as multiples of ATR (3x for stop loss, 5x for take profit), ensuring flexibility with market volatility to optimise exit points.
Entry & Exit Conditions:
Buy Entry: T riggered when any of the following conditions are met:
MACD Line crosses above the Signal Line
RSI is oversold
Price drops below the lower Bollinger Band
Sell Entry: Triggered when any of the following conditions are met:
MACD Line crosses below the Signal Line
RSI is overbought
Price moves above the upper Bollinger Band
Exit Strategy: Trades are closed based on opposing entry signals, with adaptive spread adjustments for realistic exit points.
Backtesting Configuration & Results:
Backtesting Period: July 21, 2024, to October 30, 2024
Symbol Info: XAUUSD, 10-minute timeframe, OANDA data source
Backtesting Capital: Initial capital of $700, with each trade set to 10 contracts (equivalent to approximately 0.1 lots based on the broker’s contract size for gold).
Users should confirm their broker's contract size for gold, as this may differ. This script uses 10 contracts for backtesting purposes, aligned with 0.1 lots on brokers offering a 100-contract specification.
Key Backtesting Performance Metrics:
Net Profit: $4,733.90 USD (676.27% increase)
Total Closed Trades: 526
Win Rate: 53.99%
Profit Factor: 1.44 (1.96 for Long trades, 1.14 for Short trades)
Max Drawdown: $819.75 USD (56.33% of equity)
Sharpe Ratio: 1.726
Average Trade: $9.00 USD (0.04% of equity per trade)
This backtest reflects realistic conditions, with a spread adjustment of 38 points and no slippage or commission applied. The settings aim to simulate typical retail trading conditions. However, please adjust the initial capital, contract size, and other settings based on your account specifics for best results.
Usage:
This strategy is tuned specifically for XAUUSD on a 10-minute timeframe, ideal for both trend-following and reversal trades. The ATR-based stop loss and take profit levels adapt dynamically to market volatility, optimising entries and exits in varied conditions. To backtest this script accurately, ensure your broker’s contract specifications for gold align with the parameters used in this strategy.

Supertrend StrategyThe Supertrend Strategy was created based on the Supertrend and Relative Strength Index (RSI) indicators, widely respected tools in technical analysis. This strategy combines these two indicators to capture market trends with precision and reliability, looking for optimizing exit levels at oversold or overbought price levels.
The Supertrend indicator identifies trend direction based on price and volatility by using the Average True Range (ATR). The ATR measures market volatility by calculating the average range between an asset’s high and low prices over a set period. It provides insight into price fluctuations, with higher ATR values indicating increased volatility and lower values suggesting stability. The Supertrend Indicator plots a line above or below the price, signaling potential buy or sell opportunities: when the price closes above the Supertrend line, an uptrend is indicated, while a close below the line suggests a downtrend. This line shifts as price movements and volatility levels change, acting as both a trailing stop loss and trend confirmation.
To enhance the Supertrend strategy, the Relative Strength Index (RSI) has been added as an exit criterion. As a momentum oscillator, the RSI indicates overbought (usually above 70) or oversold (usually below 30) conditions. This integration allows trades to close when the asset is overbought or oversold, capturing gains before a possible reversal, even if the percentage take profit level has not been reached. This mechanism aims to prevent losses due to market reversals before the Supertrend signal changes.
### Key Features
1. **Entry criteria**:
- The strategy uses the Supertrend indicator calculated by adding or subtracting a multiple of the ATR from the closing price, depending on the trend direction.
- When the price crosses above the Supertrend line, the strategy signals a long (buy) entry. Conversely, when the price crosses below, it signals a short (sell) entry.
- The strategy performs a reversal if there is an open position and a change in the direction of the supertrend occurs
2. **Exit criteria**:
- Take profit of 30% (default) on the average position price.
- Oversold (≤ 5) or overbought (≥ 95) RSI
- Reversal when there is a change in direction of the Supertrend
3. **No Repainting**:
- This strategy is not subject to repainting, as long as the timeframe configured on your chart is the same as the supertrend timeframe .
4. **Position Sizing by Equity and risk management**:
- This strategy has a default configuration to operate with 35% of the equity. At the time of opening the position, the supertrend line is typically positioned at about 12 to 16% of the entry price. This way, the strategy is putting at risk about 16% of 35% of equity, that is, around 5.6% of equity for each trade. The percentage of equity can be adjusted by the user according to their risk management.
5. **Backtest results**:
- This strategy was subjected to deep backtesting and operations in replay mode, including transaction fees of 0.12%, and slippage of 5 ticks.
- The past results in deep backtest and replay mode were compatible and profitable (Variable results depending on the take profit used, supertrend and RSI parameters). However, it should be noted that few operations were evaluated, since the currency in question has been created for a short time and the frequency of operations is relatively small.
- Past results are no guarantee of future results. The strategy's backtest results may even be due to overfitting with past data.
Default Settings
Chart timeframe: 2h
Supertrend Factor: 3.42
ATR period: 14
Supertrend timeframe: 2 h
RSI timeframe: 15 min
RSI Lenght: 5 min
RSI Upper limit: 95
RSI Lower Limit: 5
Take Profit: 30%
BYBIT:1000000MOGUSDT.P

STANDARD DEVIATION INDICATOR BY WISE TRADERWISE TRADER STANDARD DEVIATION SETUP: The Ultimate Volatility and Trend Analysis Tool
Unlock the power of STANDARD DEVIATIONS like never before with the this indicator, a versatile and comprehensive tool designed for traders who seek deeper insights into market volatility, trend strength, and price action. This advanced indicator simultaneously plots three sets of customizable Deviations, each with unique settings for moving average types, standard deviations, and periods. Whether you’re a swing trader, day trader, or long-term investor, the STANDARD DEVIATION indicator provides a dynamic way to spot potential reversals, breakouts, and trend-following opportunities.
Key Features:
STANDARD DEVIATIONS Configuration : Monitor three different Bollinger Bands at the same time, allowing for multi-timeframe analysis within a single chart.
Customizable Moving Average Types: Choose from SMA, EMA, SMMA (RMA), WMA, and VWMA to calculate the basis of each band according to your preferred method.
Dynamic Standard Deviations: Set different standard deviation multipliers for each band to fine-tune sensitivity for various market conditions.
Visual Clarity: Color-coded bands with adjustable thicknesses provide a clear view of upper and lower boundaries, along with fill backgrounds to highlight price ranges effectively.
Enhanced Trend Detection: Identify potential trend continuation, consolidation, or reversal zones based on the position and interaction of price with the three bands.
Offset Adjustment: Shift the bands forward or backward to analyze future or past price movements more effectively.
Why Use Triple STANDARD DEVIATIONS ?
STANDARD DEVIATIONS are a popular choice among traders for measuring volatility and anticipating potential price movements. This indicator takes STANDARD DEVIATIONS to the next level by allowing you to customize and analyze three distinct bands simultaneously, providing an unparalleled view of market dynamics. Use it to:
Spot Volatility Expansion and Contraction: Track periods of high and low volatility as prices move toward or away from the bands.
Identify Overbought or Oversold Conditions: Monitor when prices reach extreme levels compared to historical volatility to gauge potential reversal points.
Validate Breakouts: Confirm the strength of a breakout when prices move beyond the outer bands.
Optimize Risk Management: Enhance your strategy's risk-reward ratio by dynamically adjusting stop-loss and take-profit levels based on band positions.
Ideal For:
Forex, Stocks, Cryptocurrencies, and Commodities Traders looking to enhance their technical analysis.
Scalpers and Day Traders who need rapid insights into market conditions.
Swing Traders and Long-Term Investors seeking to confirm entry and exit points.
Trend Followers and Mean Reversion Traders interested in combining both strategies for maximum profitability.
Harness the full potential of STANDARD DEVIATIONS with this multi-dimensional approach. The "STANDARD DEVIATIONS " indicator by WISE TRADER will become an essential part of your trading arsenal, helping you make more informed decisions, reduce risks, and seize profitable opportunities.
Who is WISE TRADER ?
Wise Trader is a highly skilled trader who launched his channel in 2020 during the COVID-19 pandemic, quickly building a loyal following. With thousands of paid subscribed members and over 70,000 YouTube subscribers, Wise Trader has become a trusted authority in the trading world. He is known for his ability to navigate significant events, such as the Indian elections and stock market crashes, providing his audience with valuable insights into market movements and volatility. With a deep understanding of macroeconomics and its correlation to global stock markets, Wise Trader shares informed strategies that help traders make better decisions. His content covers technical analysis, trading setups, economic indicators, and market trends, offering a comprehensive approach to understanding financial markets. The channel serves as a go-to resource for traders who want to enhance their skills and stay informed about key market developments.

Ultimate Oscillator Trading StrategyThe Ultimate Oscillator Trading Strategy implemented in Pine Script™ is based on the Ultimate Oscillator (UO), a momentum indicator developed by Larry Williams in 1976. The UO is designed to measure price momentum over multiple timeframes, providing a more comprehensive view of market conditions by considering short-term, medium-term, and long-term trends simultaneously. This strategy applies the UO as a mean-reversion tool, seeking to capitalize on temporary deviations from the mean price level in the asset’s movement (Williams, 1976).
Strategy Overview:
Calculation of the Ultimate Oscillator (UO):
The UO combines price action over three different periods (short-term, medium-term, and long-term) to generate a weighted momentum measure. The default settings used in this strategy are:
Short-term: 6 periods (adjustable between 2 and 10).
Medium-term: 14 periods (adjustable between 6 and 14).
Long-term: 20 periods (adjustable between 10 and 20).
The UO is calculated as a weighted average of buying pressure and true range across these periods. The weights are designed to give more emphasis to short-term momentum, reflecting the short-term mean-reversion behavior observed in financial markets (Murphy, 1999).
Entry Conditions:
A long position is opened when the UO value falls below 30, indicating that the asset is potentially oversold. The value of 30 is a common threshold that suggests the price may have deviated significantly from its mean and could be due for a reversal, consistent with mean-reversion theory (Jegadeesh & Titman, 1993).
Exit Conditions:
The long position is closed when the current close price exceeds the previous day’s high. This rule captures the reversal and price recovery, providing a defined point to take profits.
The use of previous highs as exit points aligns with breakout and momentum strategies, as it indicates sufficient strength for a price recovery (Fama, 1970).
Scientific Basis and Rationale:
Momentum and Mean-Reversion:
The strategy leverages two well-established phenomena in financial markets: momentum and mean-reversion. Momentum, identified in earlier studies like those by Jegadeesh and Titman (1993), describes the tendency of assets to continue in their direction of movement over short periods. Mean-reversion, as discussed by Poterba and Summers (1988), indicates that asset prices tend to revert to their mean over time after short-term deviations. This dual approach aims to buy assets when they are temporarily oversold and capitalize on their return to the mean.
Multi-timeframe Analysis:
The UO’s incorporation of multiple timeframes (short, medium, and long) provides a holistic view of momentum, unlike single-period oscillators such as the RSI. By combining data across different timeframes, the UO offers a more robust signal and reduces the risk of false entries often associated with single-period momentum indicators (Murphy, 1999).
Trading and Market Efficiency:
Studies in behavioral finance, such as those by Shiller (2003), show that short-term inefficiencies and behavioral biases can lead to overreactions in the market, resulting in price deviations. This strategy seeks to exploit these temporary inefficiencies, using the UO as a signal to identify potential entry points when the market sentiment may have overly pushed the price away from its average.
Strategy Performance:
Backtests of this strategy show promising results, with profit factors exceeding 2.5 when the default settings are optimized. These results are consistent with other studies on short-term trading strategies that capitalize on mean-reversion patterns (Jegadeesh & Titman, 1993). The use of a dynamic, multi-period indicator like the UO enhances the strategy’s adaptability, making it effective across different market conditions and timeframes.
Conclusion:
The Ultimate Oscillator Trading Strategy effectively combines momentum and mean-reversion principles to trade on temporary market inefficiencies. By utilizing multiple periods in its calculation, the UO provides a more reliable and comprehensive measure of momentum, reducing the likelihood of false signals and increasing the profitability of trades. This aligns with modern financial research, showing that strategies based on mean-reversion and multi-timeframe analysis can be effective in capturing short-term price movements.
References:
Fama, E. F. (1970). Efficient Capital Markets: A Review of Theory and Empirical Work. The Journal of Finance, 25(2), 383-417.
Jegadeesh, N., & Titman, S. (1993). Returns to Buying Winners and Selling Losers: Implications for Stock Market Efficiency. The Journal of Finance, 48(1), 65-91.
Murphy, J. J. (1999). Technical Analysis of the Financial Markets: A Comprehensive Guide to Trading Methods and Applications. New York Institute of Finance.
Poterba, J. M., & Summers, L. H. (1988). Mean Reversion in Stock Prices: Evidence and Implications. Journal of Financial Economics, 22(1), 27-59.
Shiller, R. J. (2003). From Efficient Markets Theory to Behavioral Finance. Journal of Economic Perspectives, 17(1), 83-104.
Williams, L. (1976). Ultimate Oscillator. Market research and technical trading analysis.

Simple RSI stock Strategy [1D] The "Simple RSI Stock Strategy " is designed to long-term traders. Strategy uses a daily time frame to capitalize on signals generated by the Relative Strength Index (RSI) and the Simple Moving Average (SMA). This strategy is suitable for low-leverage trading environments and focuses on identifying potential buy opportunities when the market is oversold, while incorporating strong risk management with both dynamic and static Stop Loss mechanisms.
This strategy is recommended for use with a relatively small amount of capital and is best applied by diversifying across multiple stocks in a strong uptrend, particularly in the S&P 500 stock market. It is specifically designed for equities, and may not perform well in other markets such as commodities, forex, or cryptocurrencies, where different market dynamics and volatility patterns apply.
Indicators Used in the Strategy:
1. RSI (Relative Strength Index):
- The RSI is a momentum oscillator used to identify overbought and oversold conditions in the market.
- This strategy enters long positions when the RSI drops below the oversold level (default: 30), indicating a potential buying opportunity.
- It focuses on oversold conditions but uses a filter (SMA 200) to ensure trades are only made in the context of an overall uptrend.
2. SMA 200 (Simple Moving Average):
- The 200-period SMA serves as a trend filter, ensuring that trades are only executed when the price is above the SMA, signaling a bullish market.
- This filter helps to avoid entering trades in a downtrend, thereby reducing the risk of holding positions in a declining market.
3. ATR (Average True Range):
- The ATR is used to measure market volatility and is instrumental in setting the Stop Loss.
- By multiplying the ATR value by a custom multiplier (default: 1.5), the strategy dynamically adjusts the Stop Loss level based on market volatility, allowing for flexibility in risk management.
How the Strategy Works:
Entry Signals:
The strategy opens long positions when RSI indicates that the market is oversold (below 30), and the price is above the 200-period SMA. This ensures that the strategy buys into potential market bottoms within the context of a long-term uptrend.
Take Profit Levels:
The strategy defines three distinct Take Profit (TP) levels:
TP 1: A 5% from the entry price.
TP 2: A 10% from the entry price.
TP 3: A 15% from the entry price.
As each TP level is reached, the strategy closes portions of the position to secure profits: 33% of the position is closed at TP 1, 66% at TP 2, and 100% at TP 3.
Visualizing Target Points:
The strategy provides visual feedback by plotting plotshapes at each Take Profit level (TP 1, TP 2, TP 3). This allows traders to easily see the target profit levels on the chart, making it easier to monitor and manage positions as they approach key profit-taking areas.
Stop Loss Mechanism:
The strategy uses a dual Stop Loss system to effectively manage risk:
ATR Trailing Stop: This dynamic Stop Loss adjusts based on the ATR value and trails the price as the position moves in the trader’s favor. If a price reversal occurs and the market begins to trend downward, the trailing stop closes the position, locking in gains or minimizing losses.
Basic Stop Loss: Additionally, a fixed Stop Loss is set at 25%, limiting potential losses. This basic Stop Loss serves as a safeguard, automatically closing the position if the price drops 25% from the entry point. This higher Stop Loss is designed specifically for low-leverage trading, allowing more room for market fluctuations without prematurely closing positions.
to determine the level of stop loss and target point I used a piece of code by RafaelZioni, here is the script from which a piece of code was taken
Together, these mechanisms ensure that the strategy dynamically manages risk while offering robust protection against significant losses in case of sharp market downturns.
The position size has been estimated by me at 75% of the total capital. For optimal capital allocation, a recommended value based on the Kelly Criterion, which is calculated to be 59.13% of the total capital per trade, can also be considered.
Enjoy !
